
Surveillance in New Orleans (In Progress)
Data Visualization & UX/UI Design for Article on Surveillance in New Orleans
Overview
An investigative article detailing the surveillance apparatus in New Orleans, to be published by non-profit news organization the Lens. I worked closely with a journalist, a researcher, and a developer on the project.
This project is the first standalone website published by the Lens. Accounting for limited resources, and referencing the Lens’ brand elements, I designed a flexible layout and design system for the project. I also created data-visualizations and built interactive graphics for the article.
Role
UX/UI Design, Data-visualization
Tools
Figma, Photoshop, Google Maps API, Mapbox, JavaScript, HTML/CSS, Node.js
UX/UI Design, Data-visualization
Tools
Figma, Photoshop, Google Maps API, Mapbox, JavaScript, HTML/CSS, Node.js
Mockups (In Progress)
The site contains both static content and content in parallax.
The site contains both static content and content in parallax.
Category Tags
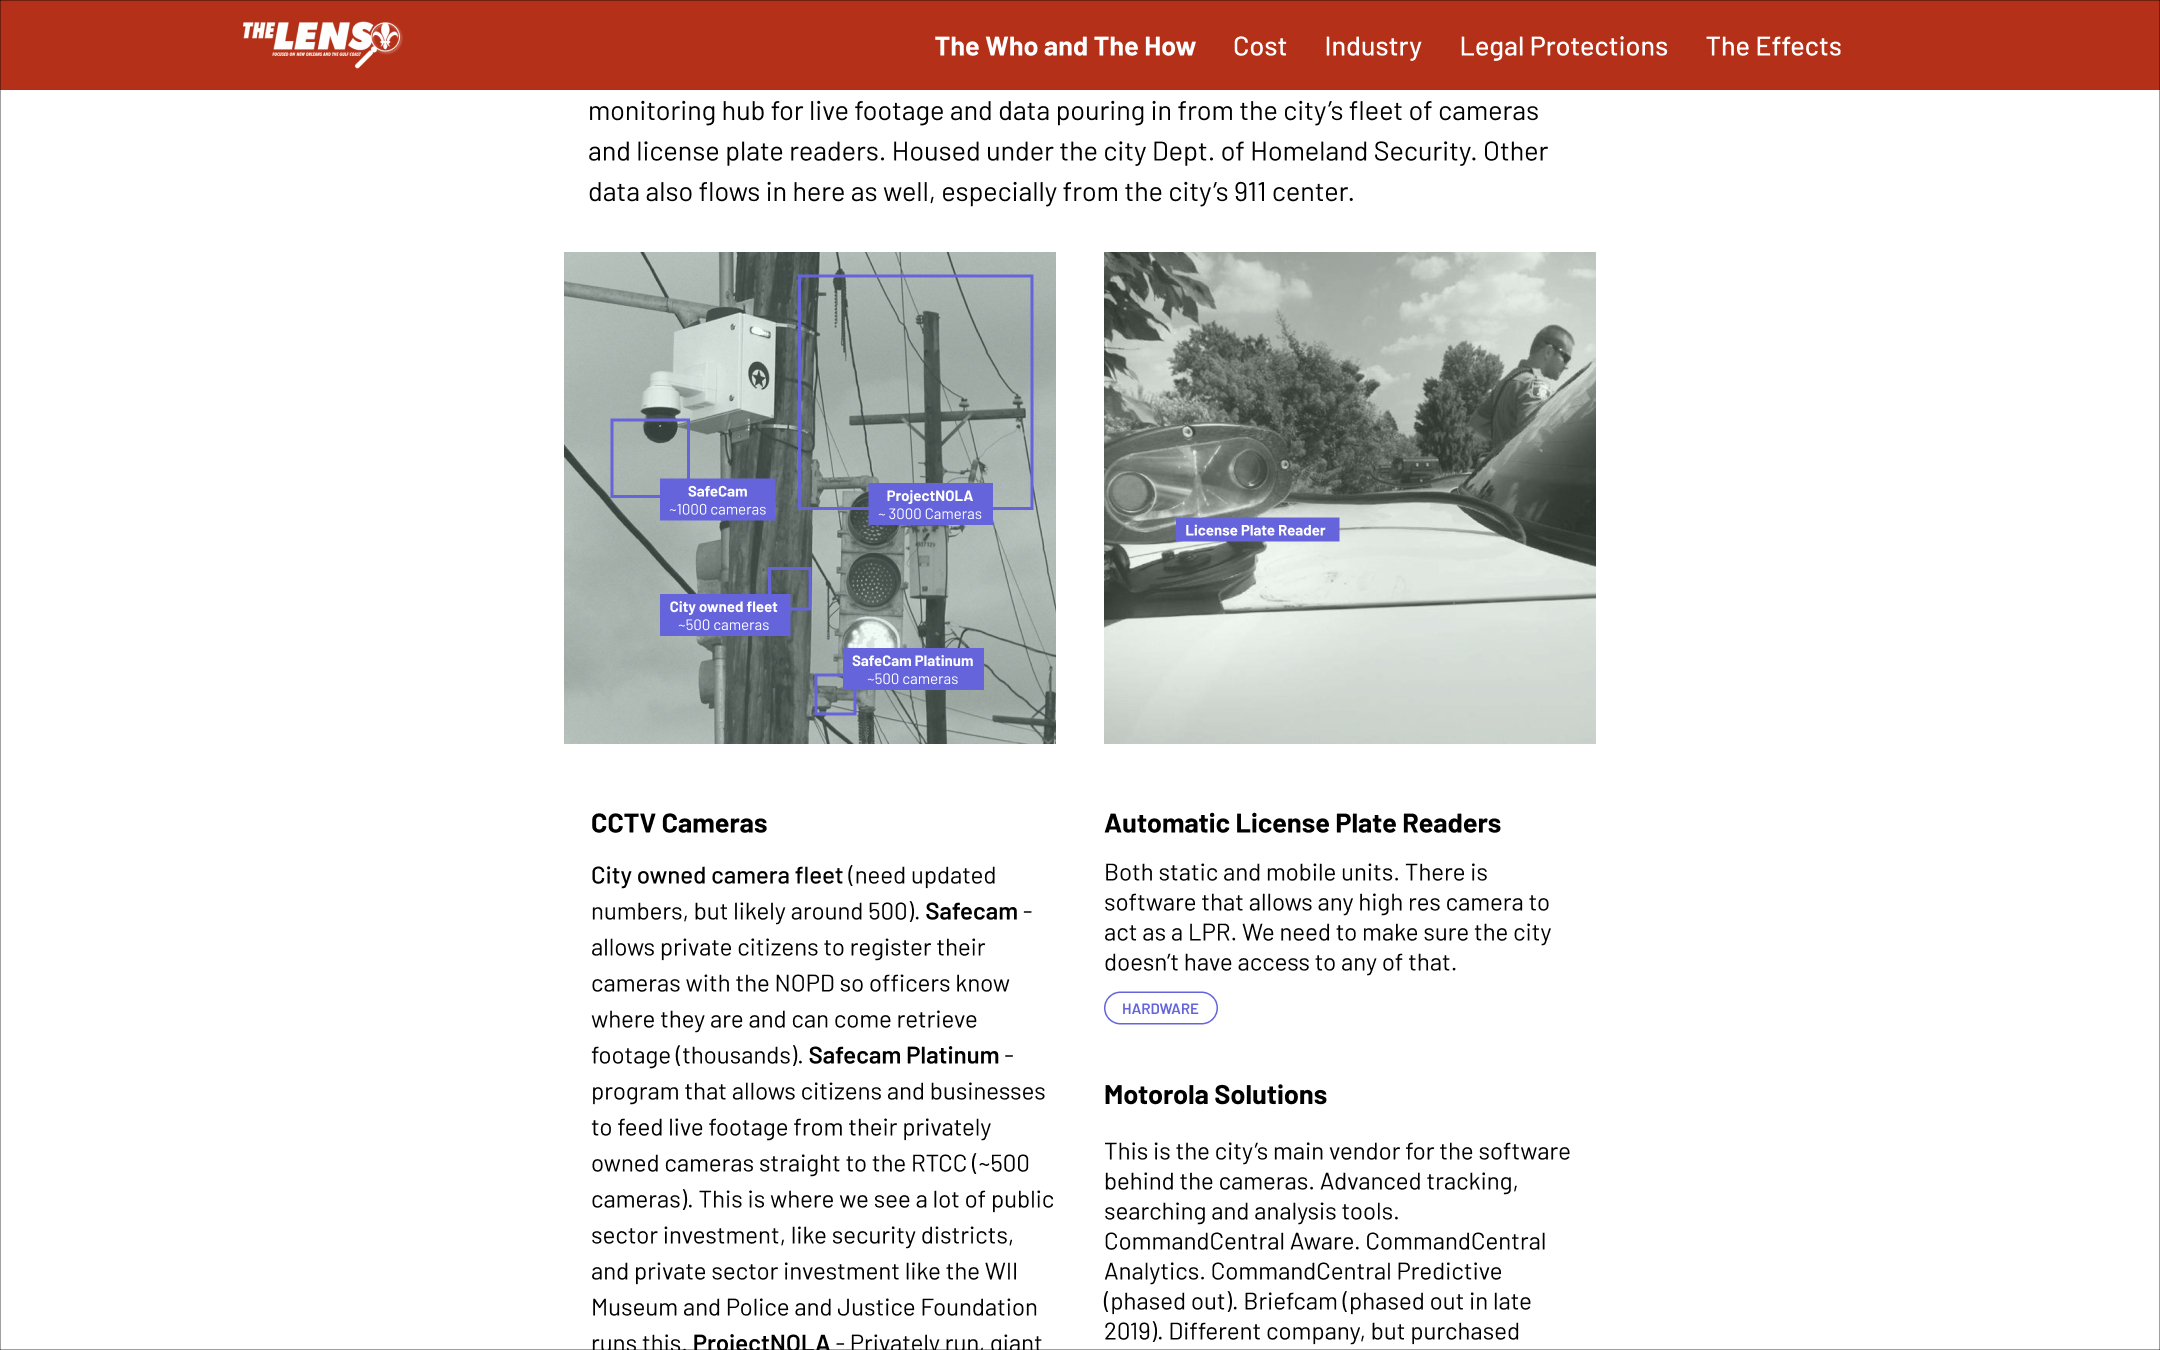
To help readers understand and indentify the range of survelliance systems, I introduced category tags — hardware, software, and platform, in the layout design.
To help readers understand and indentify the range of survelliance systems, I introduced category tags — hardware, software, and platform, in the layout design.
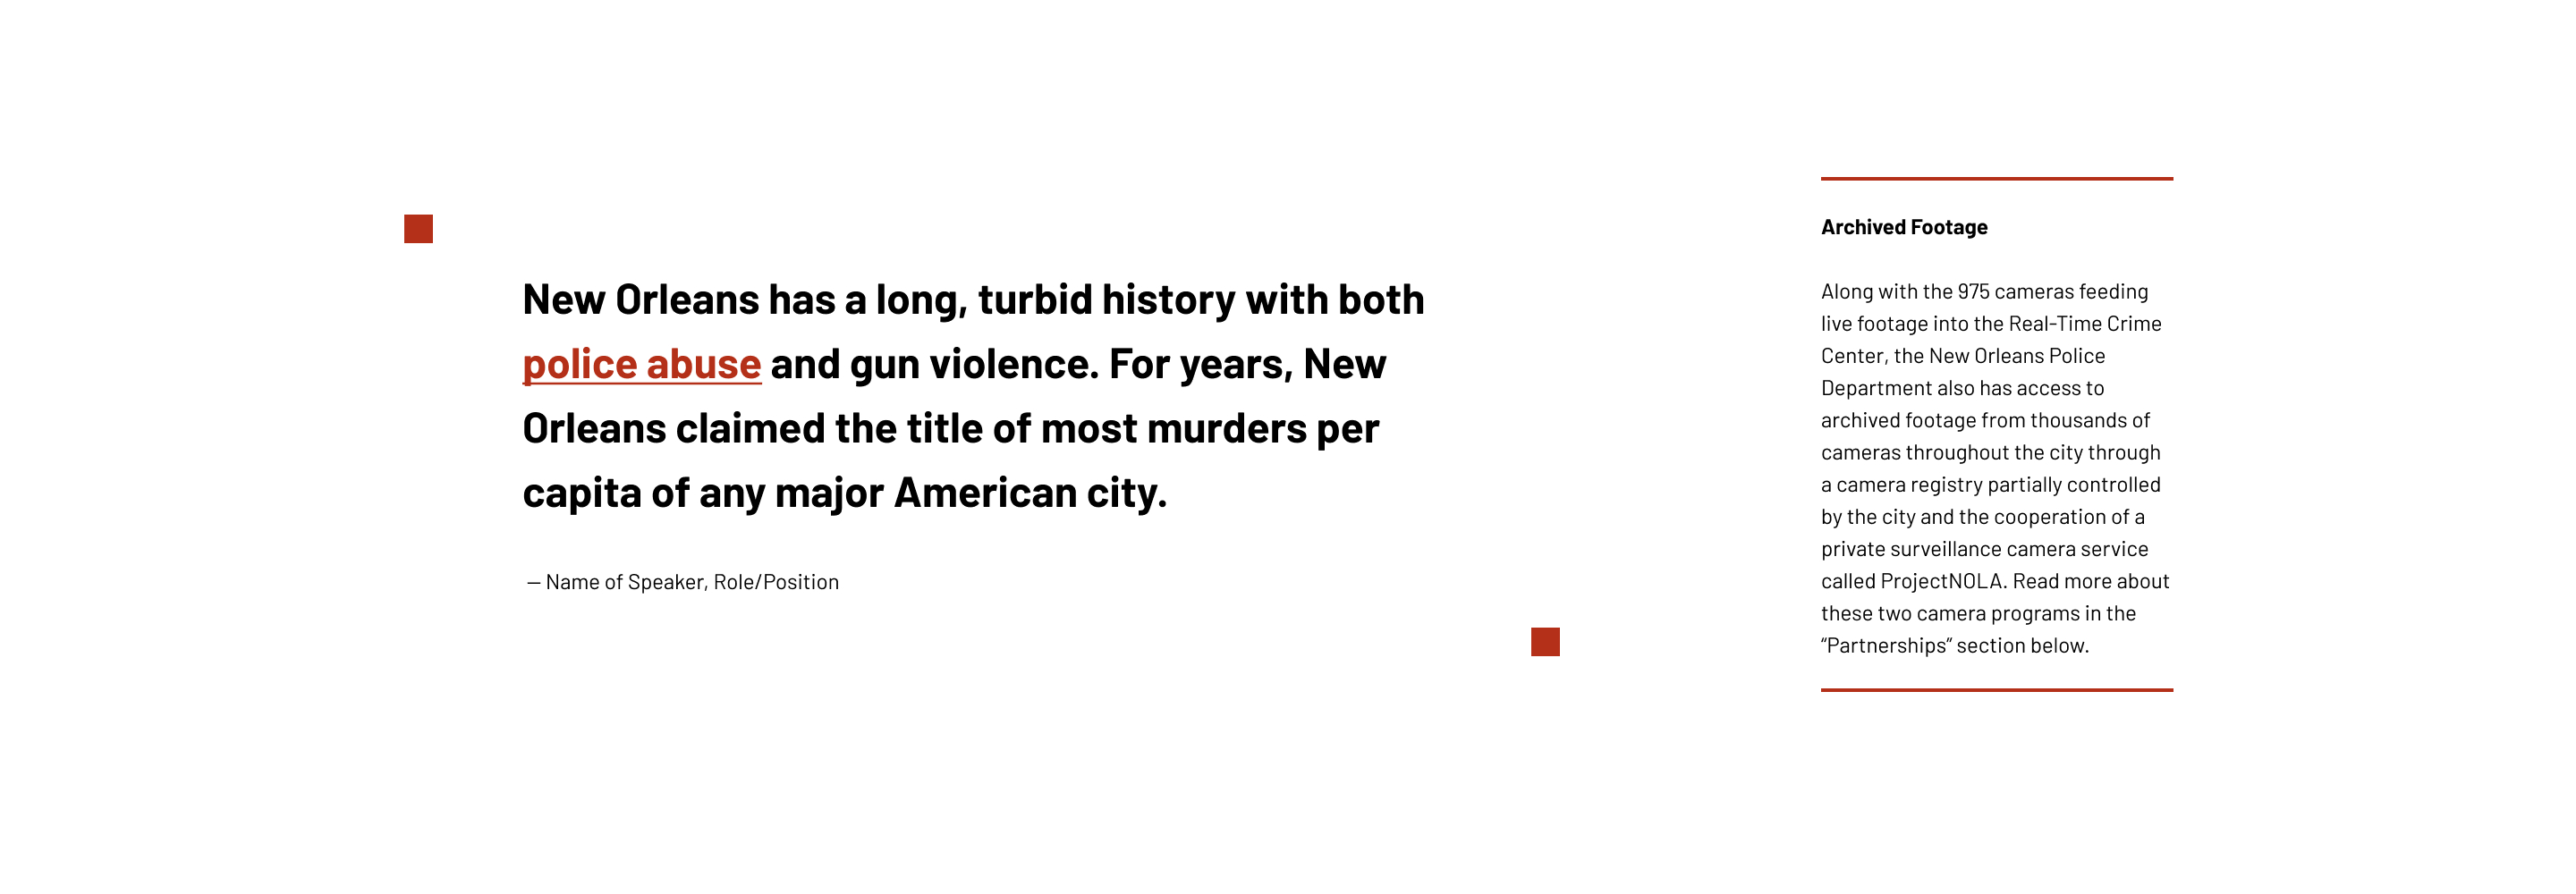
Pull Quotes & Sidebars
I suggested adding different components to breakup long paragraphs of text in order to highlight key points.
I suggested adding different components to breakup long paragraphs of text in order to highlight key points.
Static Graphics & Charts
I produced graphics and charts based on data points and information given to me by the journalist and researcher, which I then iterated on based on editorial feedback.
I produced graphics and charts based on data points and information given to me by the journalist and researcher, which I then iterated on based on editorial feedback.

Figma Prototype